The 2026 "Seller Heat Map": Why Farming the Wrong Postal Code is Costing You Six Figures
Key Takeaways
- Turnover is King: A neighborhood with 6% turnover yields 3x the income of a neighborhood with 2% turnover, even if the home prices are the same—stop farming "graveyards."
- Data > Gut Feeling: Choosing a farm because it's "close to your house" is a rookie mistake; use the Heat Map to identify areas with the highest GCI Density, regardless of location.
- The Competition Void: The Heat Map doesn't just show where homes are selling; it shows where other agents aren't looking, allowing you to swoop in and dominate high-velocity zones with zero resistance.
The 2026 "Seller Heat Map": Why Farming the Wrong Postal Code is Costing You Six Figures
Not all dirt is created equal. How to use Predictive Heat Maps to spot High-Turnover "Gold Zones" and avoid Low-Turnover "Graveyards."
The "Proximity" Trap
Ask an agent why they chose their farming area, and they usually say:
- "It’s close to my house."
- "I like the style of homes there."
- "My kids go to school there."
This is financial suicide.
You wouldn't buy a stock just because the company headquarters is near your house. You buy it based on Yield.
Yet, thousands of agents pour their marketing budget into neighborhoods with a 1.5% turnover rate, simply because it’s "convenient."
Here is the brutal math:
Neighborhood A (The Graveyard)
1,000 homes. 2% Turnover. Avg Price $1M.
Total Pool: 20 Deals/Year. (Starvation Mode).
Neighborhood B (The Gold Zone)
1,000 homes. 6% Turnover. Avg Price $800k.
Total Pool: 60 Deals/Year. (Feast Mode).
If you farm Neighborhood A, you are fighting for scraps. If you farm Neighborhood B, you can be sloppy and still get rich.
Success isn't just about how hard you work; it’s about where you plant the flag.
Stop Guessing. Look at the Heat Map.
You don't need a crystal ball to find Neighborhood B. You need the Communities Intelligence Map.
Inside our platform, we don't just show you "listings." We visualize GCI Potential. We layer data to show you exactly which Postal Codes are "Hot" (High Velocity) and which are "Cold" (Stagnant).
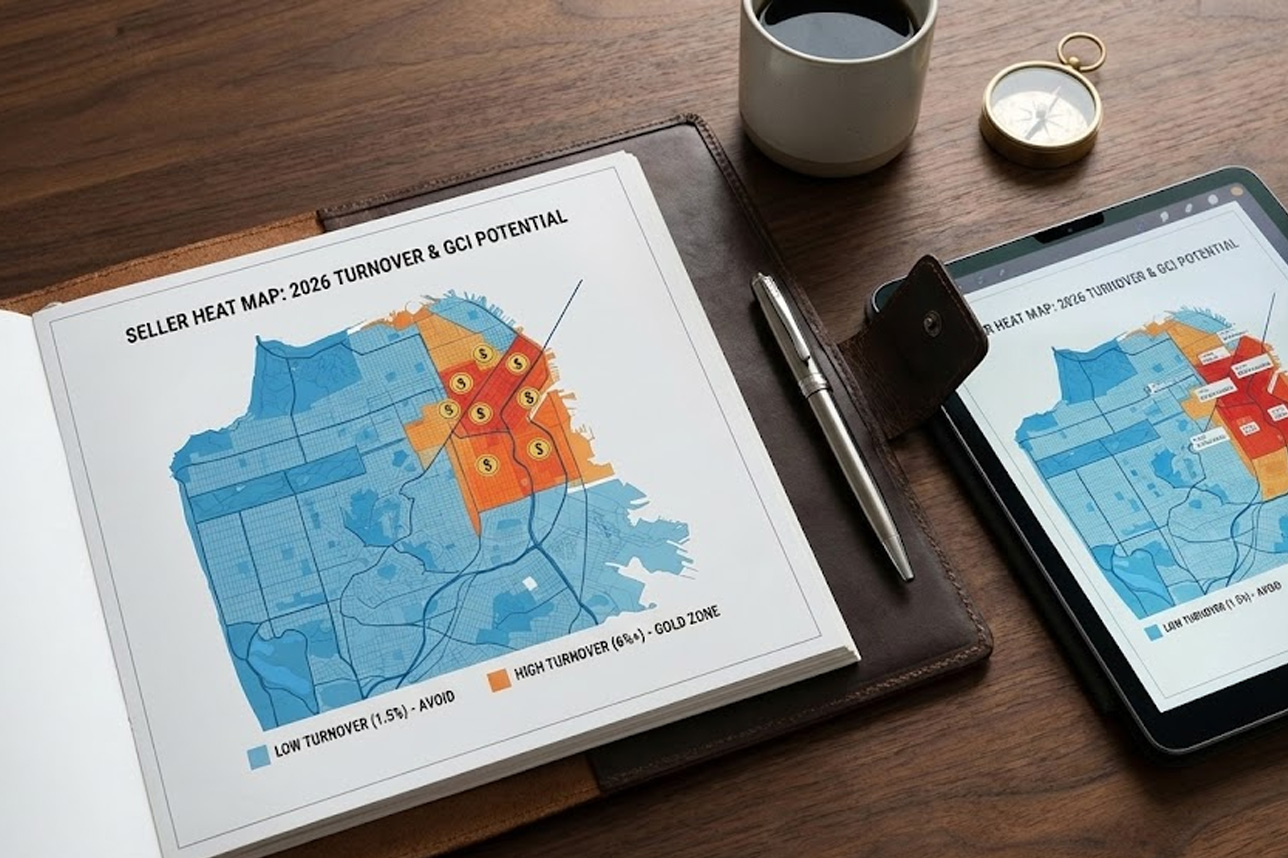
When you look at our Seller Heat Map, you see three things:
1. The Turnover Score (Velocity)
We analyze historical data to show you the "Churn Rate" of every community. You can instantly spot the zones where homeowners move every 3-5 years (Condo hubs, Starter homes) versus zones where people stay for 20 years (Estate lots).
Strategy: Don't waste ad spend on "Forever Homes." Target the "Move-Up" zones.
2. The GCI Density (Value)
We calculate the Total Addressable Commission in the area. Some areas have high turnover but low prices. Others have low turnover but massive price points.
Our map combines these to show you the "GCI per Household" metric.
Result: You can see exactly how much money is sitting on the table in M5V vs L4J.
3. The Competition Void (Opportunity)
This is your unfair advantage. The map also reveals which areas are being ignored by other major players.
If you see a High-Turnover zone with Low-Ad-Spend density... that is a Gold Mine.
Case Study: The "Moneyball" Agent
We had an agent who wanted to farm "Luxury Estates." We showed him the Heat Map. The turnover was 1.2%. He would have starved.
Instead, the map highlighted a "B-Class" neighborhood two exits down the highway.
- Turnover: 5.8%.
- Avg Price: $900k.
- Competition: Low.
He switched his target. He didn't work harder; he just moved his fishing boat to where the fish were.
He secured $400k in GCI in year one simply because the volume of transactions was there.
Audit Your Territory (Before You Commit)
Before you spend another dime on postcards or Facebook ads, you need to audit the land. Don't fly blind. Use the Communities Platform to see the data.
Here is your plan:
- Check Availability: Search the Registry to see if your desired Postal Code is "Green" (Available) or "Red" (Locked).
- Unlock the Command Center: Claim your 30-Day Free Trial of the Communities CRM.
- View the Heat Map: Once inside, use the Map Tool to analyze the turnover rates and GCI potential of your farm. Compare your current area against the "Gold Zones" nearby.
See the potential GCI per postal code before you plant your flag.
(Note: If the Postal Code is Red, the territory is already claimed by another agent. Availability is first-come, first-served.)